NO.PZ2018062016000112
问题如下:
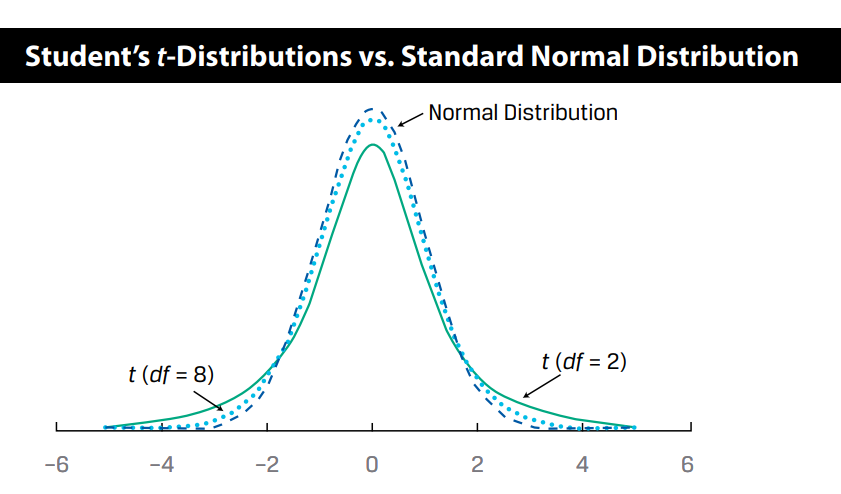
As the degrees of freedom gets larger, the shape of T-distribution most likely:
选项:
A.
approaches a standard normal distribution
B.
becomes fatter tails
C.
becomes less peaked
解释:
A is correct, when degree of freedom of the t-distribution is increase, the shape of t-distribution approaches standard normal distribution, the tails become less fat.
当t分布的自由度增加时,t分布的形状趋向标准正态分布,尾部会变的不那么肥。
能否画在一张图里?方便对比