开发者:上海品职教育科技有限公司 隐私政策详情

应用版本:4.2.11(IOS)|3.2.5(安卓)APP下载

余思敏 · 2021年05月03日

看不到图表

NO.PZ2017092702000155

问题如下:


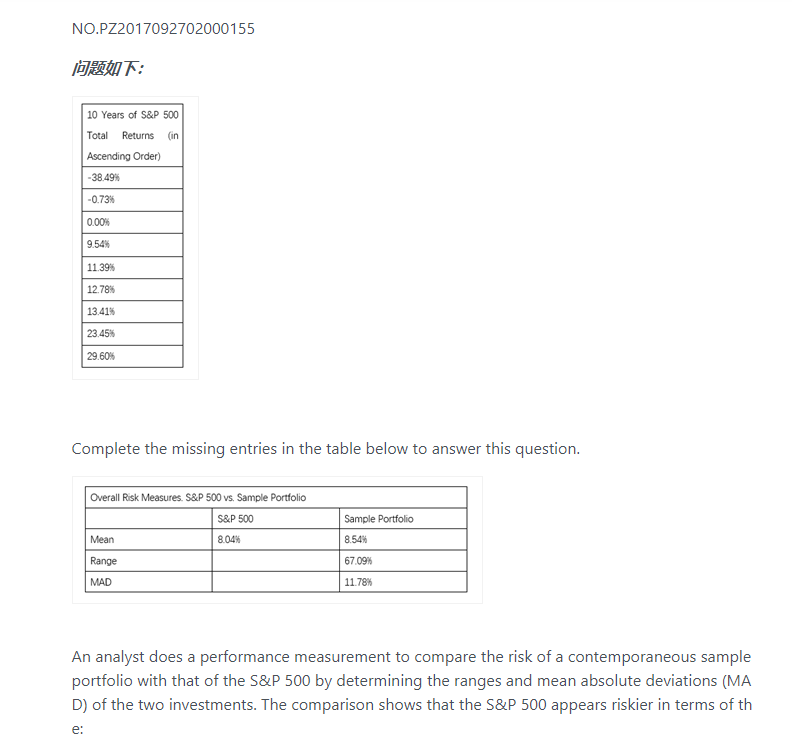
Complete the missing entries in the table below to answer this question.


An analyst does a performance measurement to compare the risk of a contemporaneous sample portfolio with that of the S&P 500 by determining the ranges and mean absolute deviations (MAD) of the two investments. The comparison shows that the S&P 500 appears riskier in terms of the:

选项:

A.

range only

B.

MAD only.

C.

MAD and range.

解释:

C is correct. Both the range and MAD of the S&P 500 are greater than the range and MAD of the sample portfolio. Thus both measures indicate the S&P 500 is riskier. The range for the S&P 500 equals the distance between the lowest and highest
values in the dataset. That distance for the S&P 500 is [29.60% – (–38.49%)] = 68.09%. Given that this range is larger than the range of the sample portfolio at 67.09%, the S&P 500 appears riskier than the sample portfolio. The MAD for the S&P 500 returns equals the sum of the absolute deviations from the mean return divided by the number of observations.

MADS&P500 = 12.67%

Given that the MAD for the S&P 500 is greater than the MAD for the sample portfolio (12.67% versus 11.78%), the S&P 500 appears riskier than the sample portfolio.
A is incorrect because although the S&P 500 is correctly identified as having the larger range, the sample portfolio has a smaller MAD.
B is incorrect because although the S&P 500 is correctly identified as having the larger MAD, the Sample Portfolio has a smaller range.


看不到图表呢,怎么解决这个问题
1 个答案

星星_品职助教 · 2021年05月03日

同学你好,

这道题的图表我从学员界面进入是可以显示的,参考如下。

有问必答并不解答技术类问题,技术类问题可以咨询辅导员。

  • 1

    回答
  • 0

    关注
  • 452

    浏览
相关问题

NO.PZ2017092702000155 第一张竖表只给了9年的值,表头说有10年。数据没少给的话是要用第二张表的均值算剩下的一年吗?

2021-07-16 22:45 1 · 回答

NO.PZ2017092702000155 Monly. Manrange. C is correct. Both the range anMof the S&P 500 are greater ththe range anMof the sample portfolio. Thus both measures incate the S&P 500 is riskier. The range for the S&P 500 equals the stanbetween the lowest anhighest values in the taset. Thstanfor the S&P 500 is [29.60% – (–38.49%)] = 68.09%. Given ththis range is larger ththe range of the sample portfolio 67.09%, the S&P 500 appears riskier ththe sample portfolio. The Mfor the S&P 500 returns equals the sum of the absolute viations from the mereturn vithe number of observations. MA&P500 = 12.67% Given ththe Mfor the S&P 500 is greater ththe Mfor the sample portfolio (12.67% versus 11.78%), the S&P 500 appears riskier ththe sample portfolio. A is incorrebecause although the S&P 500 is correctly intifiehaving the larger range, the sample portfolio ha smaller MA B is incorrebecause although the S&P 500 is correctly intifiehaving the larger MA the Sample Portfolio ha smaller range. 这个题目没看懂考察的哪个知识点能指导下没?

2021-04-28 22:48 1 · 回答

NO.PZ2017092702000155 您好,这题我想问一下关于MA不可以因为S&P500的mean比较小,相当于每个值减去的数就少了,得出的MA会大一些,所以也是risky,这样思考来省去计算的步骤对吗?谢谢。

2021-04-20 13:36 2 · 回答

NO.PZ2017092702000155 Monly. Manrange. C is correct. Both the range anMof the S&P 500 are greater ththe range anMof the sample portfolio. Thus both measures incate the S&P 500 is riskier. The range for the S&P 500 equals the stanbetween the lowest anhighest values in the taset. Thstanfor the S&P 500 is [29.60% – (–38.49%)] = 68.09%. Given ththis range is larger ththe range of the sample portfolio 67.09%, the S&P 500 appears riskier ththe sample portfolio. The Mfor the S&P 500 returns equals the sum of the absolute viations from the mereturn vithe number of observations. MA&P500 = 12.67% Given ththe Mfor the S&P 500 is greater ththe Mfor the sample portfolio (12.67% versus 11.78%), the S&P 500 appears riskier ththe sample portfolio. A is incorrebecause although the S&P 500 is correctly intifiehaving the larger range, the sample portfolio ha smaller MA B is incorrebecause although the S&P 500 is correctly intifiehaving the larger MA the Sample Portfolio ha smaller range. 题目不显示图片,截图在提问时也无法添加上传

2021-04-05 20:15 2 · 回答