开发者:上海品职教育科技有限公司 隐私政策详情

应用版本:4.2.11(IOS)|3.2.5(安卓)APP下载

HG · 2020年06月03日

问一道题:NO.PZ201710200100000203

* 问题详情,请 查看题干

问题如下:

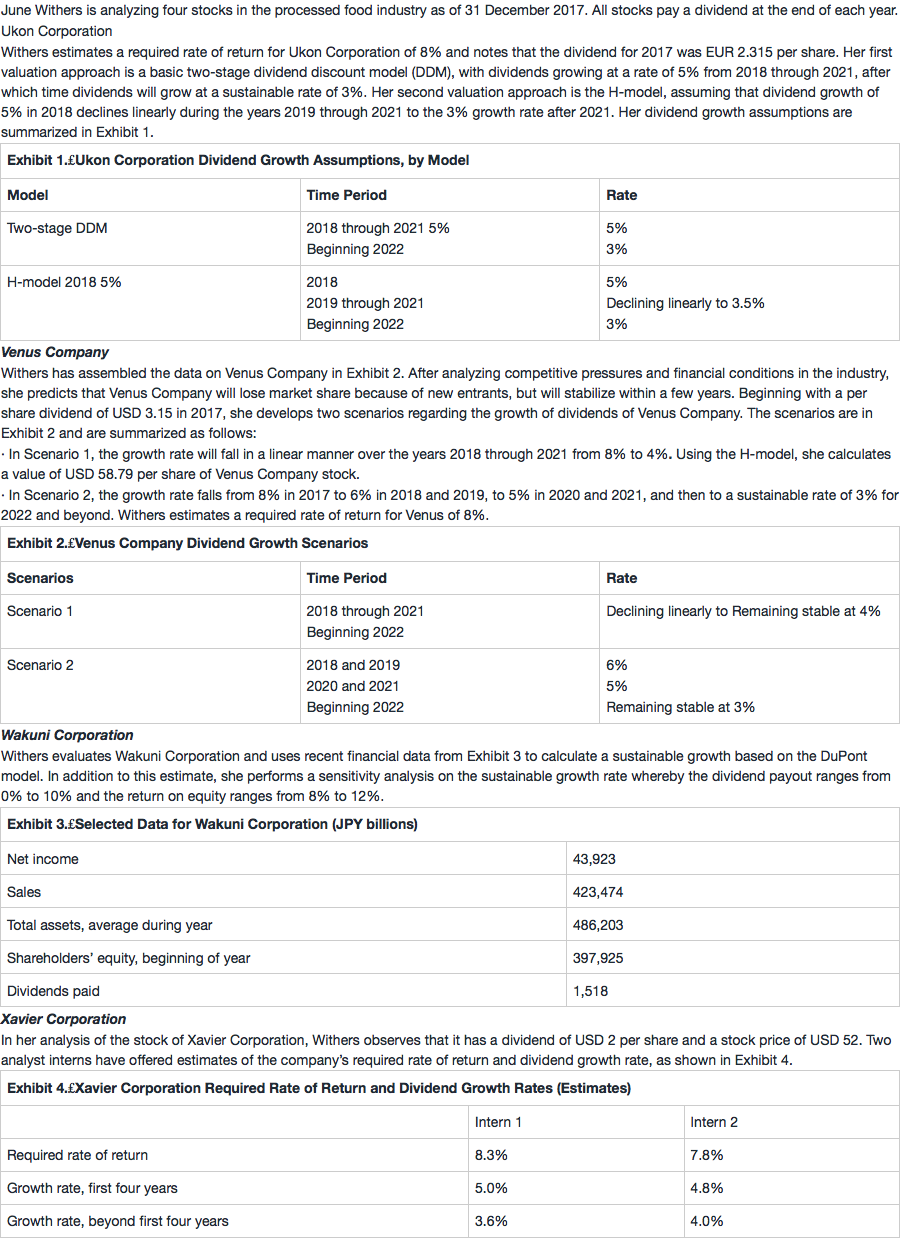
3. Using Withers’s assumptions for the H-model and the basic two-stage dividend discount model, the forecasted Ukon stock price at the end of the year 2021 for the H-model should be:

选项:

A.

lower than the basic two-stage model.

B.

the same as the basic two-stage model.

C.

higher than the basic two-stage model

解释:

A is correct. During the first stage, the basic two-stage model has higher (i.e., 5%) growth than the H-model, in which growth is declining linearly from 5.0% to 3.5%. Higher growth rates result in higher forecasted dividends and stock prices at the beginning of the sustained growth phase. Because the long-term dividend growth rates are the same for both models, the difference in forecasted stock price arises from growth rate differences in the first stage.

Therefore, the dividend at the end of the first stage will be lower for the H-model than for the basic two-stage DDM, and the terminal value will be lower in the H-model than in the two-stage model. Specifically, the 2021 dividends will be

2.734 (i.e., 2.315 × 1.05 × 1.045 × 1.04 × 1.035) for the H-model versus 2.815 [i.e., 2.315 × (1.05)4] for the basic two-stage DDM.

老师这个题算是H model吗?这个H model的公式也不是想题目的解答中那么算的啊?

1 个答案

Debrah_品职答疑助手 · 2020年06月04日

同学你好,我借用一下Maggie老师此前画的图供你参考。这道题目是问,在2021年末(2022年初)比较两种模型哪个价值大。图中(B)代表beginning.

站在2021年末(2022年初)计算价值即未来现金流折现到2021年末这个时间点,那么哪个模型未来现金流更大,哪个价值就更大。从上图可知,两阶段模型前四年都是高速增长,所以到2021年底的D一定比H模型要大,那么我们站在2021年底往后看,两阶段模型的未来现金流更高(解析中给出了详细的计算),因此它的价值更大。

  • 1

    回答
  • 0

    关注
  • 404

    浏览
相关问题

NO.PZ201710200100000203 问题如下 3. Using Withers’s assumptions for the H-mol anthe basic two-stage vinscount mol, the forecasteUkon stoprithe enof the ye2021 for the H-mol shoulbe: A.lower ththe basic two-stage mol. B.the same the basic two-stage mol. C.higher ththe basic two-stage mol A is correct. ring the first stage, the basic two-stage mol hhigher (i.e., 5%) growth ththe H-mol, in whigrowth is clining linearly from 5.0% to 3.5%. Higher growth rates result in higher forecastevin anstoprices the beginning of the sustainegrowth phase. Because the long-term vingrowth rates are the same for both mols, the fferenin forecastestopriarises from growth rate fferences in the first stage.Therefore, the vinthe enof the first stage will lower for the H-mol thfor the basic two-stage M, anthe terminvalue will lower in the H-mol thin the two-stage mol. Specifically, the 2021 vin will be2.734 (i.e., 2.315 × 1.05 × 1.045 × 1.04 × 1.035) for the H-mol versus 2.815 [i.e., 2.315 × (1.05)4] for the basic two-stage M. 看到有同学也问“老师,我的思路是直接画图,Hmol是三角形,而two stage是长方形,所以two stage面积大,这样可以吗”。老师回答完全正确。看到老师的解说,及视频老师的讲解都说,这个提问的是在2021年末(2022年初)比较两种模型哪个价值大?我觉得这个里面有个很大的误导(请老师认真帮忙看看是否这个逻辑)1、本题不是考两个模式在最初时间计算的出来的价值谁大?不是去对比两个方法的总价值。如果是,总价值肯定是很简单的,肯定H模型是小的,面积不同。也就是有的同学说的比较面积。2、但这个题考的是站到2022年这个时点往后看,两个模型假设的最终的g都是一样的情况下,谁的估值更大。3、是指因为2022年初这个时点的不同,所以就用GGM公式直接计算出来金额不同的,那就是谁在2022年的更大,谁的估值就更大。

2022-08-27 22:02 1 · 回答

NO.PZ201710200100000203 老师请教一下,H-mol是从高增长率的阶段线性下降linecrease to低增长阶段,近似等于斜线,实际为阶梯状,那么计算的时候到底什么时候直接用H-MOL的公式 V0=【*(1+g)+*H/2*(gh-gl)】/re-g 什么时候用解析的每过一年下降0.5%,如 求=*1.05*1.045*1.04*1.035

2021-11-23 23:57 1 · 回答

NO.PZ201710200100000203 老师,我的思路是直接画图,Hmol是三角形,而two stage是长方形,所以two stage面积大,这样可以吗

2021-04-07 21:16 1 · 回答

我是直接通过画图得出的。 一个是一直保持较高的增长率,然后突然进入第二阶段。一个是线性下降进入第二阶段。 因此前者第一阶段最后一个v一定比后一个大,前者第一阶段的现金流也比第二个大。 所以就选了更大。 请问这样可以吗?

2020-11-22 20:51 1 · 回答

老师您好,这里的比较是不是建立在总值不变的基础上,只讨论在前后两阶段的分配上?

2020-11-08 17:40 1 · 回答