问题如下:
During the table below, the mean monthly return of X Index in the first five years have been different than the mean return in the second five years.
Let the μ1 stand for the population mean return for the year1 through year 5 and μ2 stand for the population mean return for the year 6 through year 10, the following hypothese: H0: μ1 – μ2 = 0 versus Ha: μ1 – μ2 ≠ 0
Assume that the significant level is 0.05
Which of the following options is most accurate?

选项:
A.The null hypothesis will be rejected if t<-1.98 or t>1.98.
B.The t-test has 119 degrees of freedom.
C.The rejection points are ±1.658.
解释:
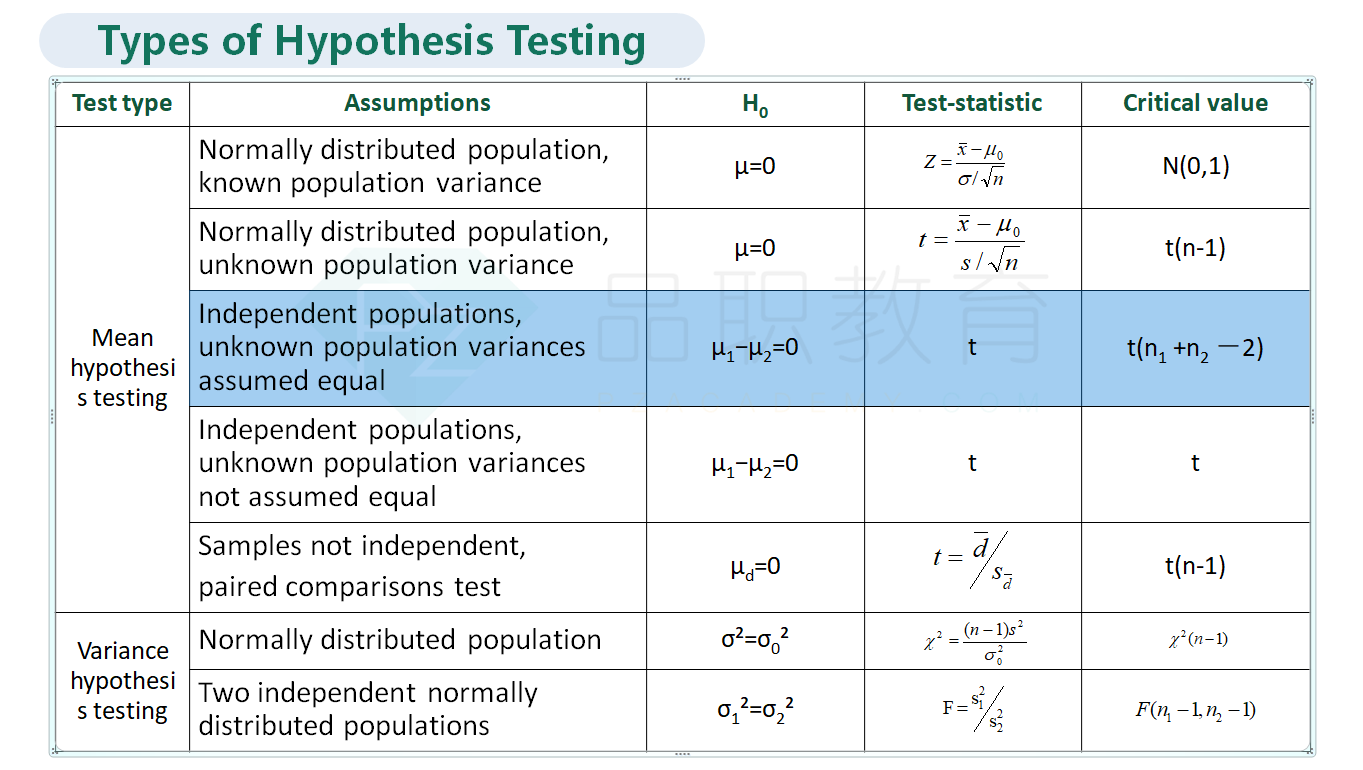
A is correct. The two samples are drawn from two different time periods, so they are independent samples. The population variances can be assumed to be equal. Under all considerations, the t-test has 60+60-2=118 degrees of freedom.For a two-tailed test, at the significant level of 0.05, the rejection points are ±1.980, so we will reject the null if t<-1.980 or t>1.980.
老师这个题解题思路和步骤是什么?
t 分布表,在书中是附录叫什么名字?
怎么找t 分布的1.98? 是哪个公式?
Hypothesis test 不是应该是四步吗?这个题对应的四部应该怎么理解?


