NO.PZ2024030508000093
问题如下:
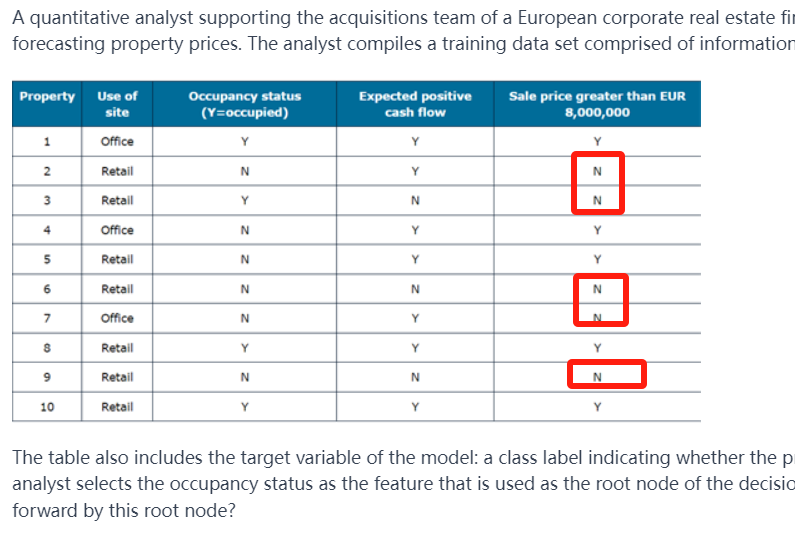
A quantitative analyst supporting the acquisitions team of a European corporate real estate firm is using the decision tree technique to create a model for forecasting property prices. The analyst compiles a training data set comprised of information from 10 recent property sales, as shown in the following table:
选项:
A.0.09 B.0.37 C.0.44 D.0.82解释:
Explanation: A is correct. Before we can calculate the information gain as Ginibase − Giniweighted, we first calculate for the base-level Gini measure by looking at the output variable being considered before we know anything about the features.
There are 5 properties that sold above EUR 8,000,000 and 5 that sold below.
Ginibase =
Using the feature “occupancy status” as the root node, we examine this feature and find that for the 4 properties that were occupied, 3 sold above the amount and only 1 sold below.
Ginioccupied =
In a similar fashion, we find that for the 6 properties that were not occupied, 2 sold above the amount and 4 sold below.
Gininotoccupied =
Thus, the weighted Gini measure for this feature is obtained as:
Giniweighted =
Therefore, Information Gain = Ginibase − Giniweighted = 0.50-0.4097 = 0.0902 or approximately 0.09.
B is incorrect. This is just the Gini measure for the sold properties that were occupied.
C is incorrect. This is just the Gini measure for the sold properties that were not occupied.
D is incorrect. This is the unweighted sum of the Gini measure for the sold properties that were occupied and the Gini measure for the sold properties that weren’t occupied (0.375 + 0.444).
Learning Objective: Show how a decision tree is constructed and interpreted.
Reference: Global Association of Risk Professionals. Quantitative Analysis. New York, NY: Pearson, 2023, Chapter 15, Machine Learning and Prediction [QA-15].
如题


