NO.PZ2024030508000008
问题如下:
A junior trader on a derivatives trading desk is using historical data to run a linear regression model that regresses the price of an option against the underlying stock price. The trader conducts an analysis of the regression results to identify potential outliers and assess their impact on the estimated coefficients. Which of the following statements correctly describes the given approach for identifying outliers?
选项:
A.A residual plot compares the error values on the x-axis against the realization of the explanatory variables on the y-axis. B.Residual plots can only detect outliers that are typically within 4 standard deviations of the model mean.
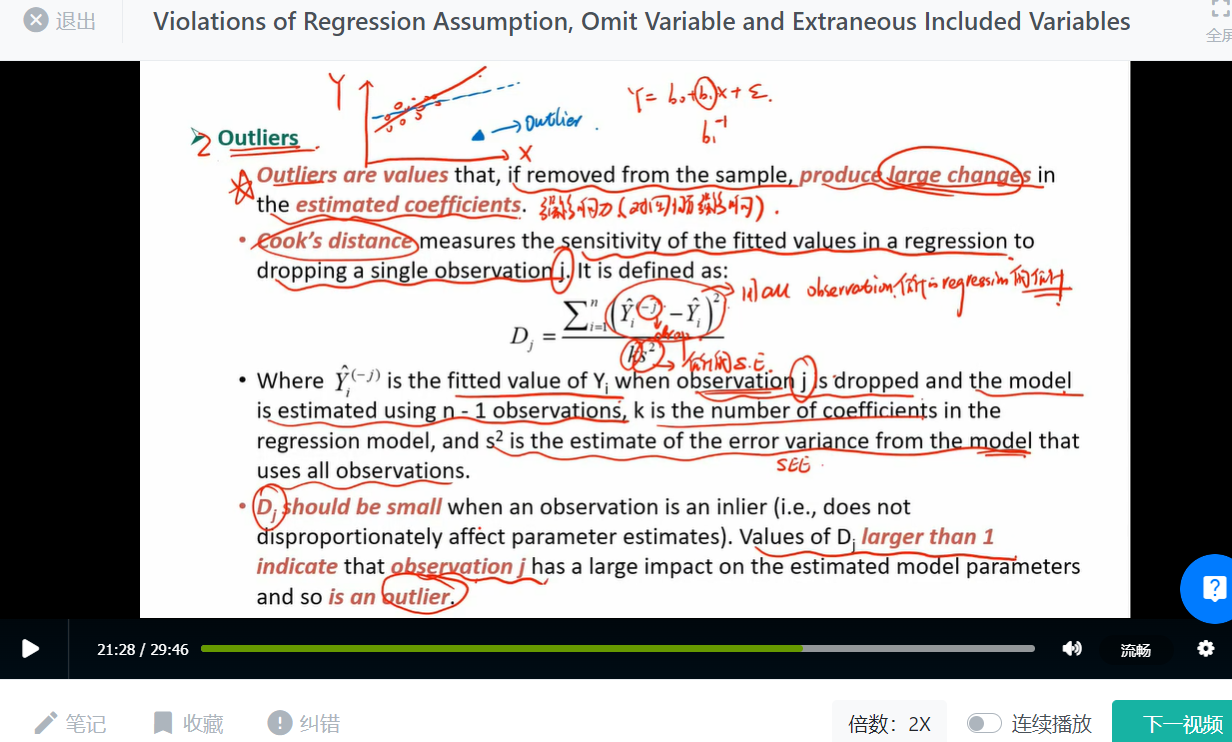
A Cook’s distance value greater than 1 indicates that an observation has a large impact on the regression parameters.
解释:
Explanation: C is correct. Cook’s distance, D, should be small when an observation is an inlier (i.e. does not disproportionately affect parameter estimates). Values of D>1 indicate that an observation has a large impact on the estimated model parameters and so is an outlier.
A is incorrect. Residual values are plotted along the y-axis and fitted values, or another variable, are plotted on the x-axis.
B is incorrect. Both outliers and model specification problems (omitted nonlinear relationships) can be detected in residual plots. An ideal model would display residuals that are relatively small magnitude(i.e., typically within 4s, where s2 is the estimated variance of the shocks in the model).
D is incorrect. Cook’s distance measures the sensitivity of the fitted values in a regression to dropping a single observation.
Learning Objective: Describe methods for identifying outliers and their impact.
Reference: Global Association of Risk Professionals. Quantitative Analysis. New York, NY: Pearson, 2023, Chapter 9, Regression Diagnostics [QA-9].
Cook’s distance这个好像没学过啊?另外可以再解释下每个选项吗?


