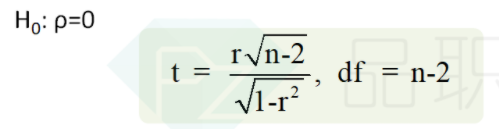
NO.PZ2017092702000162
问题如下:
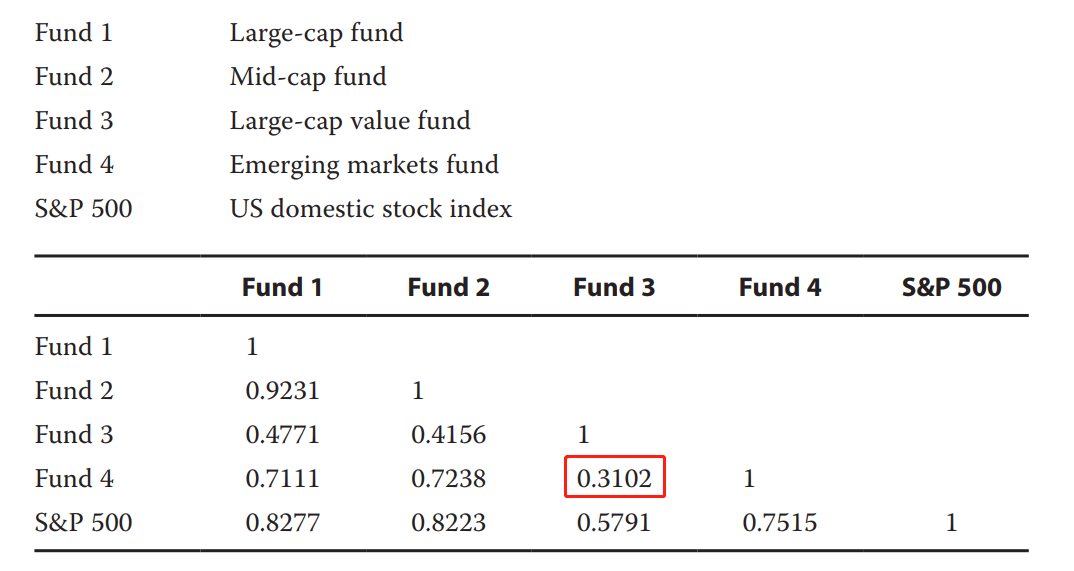
The following table shows the sample correlations between the monthly returns for four different mutual funds and the S&P 500. The correlations are based on 36 monthly observations. The funds are as follows:

Test the null hypothesis that each of these correlations, individually, is equal to zero against the alternative hypothesis that it is not equal to zero. Use a 5 percent significance level.
选项:
解释:
The critical t-value for n − 2 = 34 df, using a 5 percent significance level and a two-tailed test, is 2.032. First, take the smallest correlation in the table, the correlation between Fund 3 and Fund 4, and see if it is significantly different from zero. Accoding to the formula of correlaion t-test, its calculated t-value is t=1.903. This correlation is not significantly different from zero. If we take the next lowest correlation, between Fund 2 and Fund 3, this correlation of 0.4156 has a calculated t-value of 2.664. So this correlation is significantly different from zero at the 5 percent level of significance. All of the other correlations in the table (besides the 0.3102) are greater than 0.4156, so they too are significantly different from zero.
问的啥也没看懂