开发者:上海品职教育科技有限公司 隐私政策详情

应用版本:4.2.11(IOS)|3.2.5(安卓)APP下载

Helen 🎈 · 2023年11月07日

total debt 不等于total liability

NO.PZ2023081403000042

问题如下:

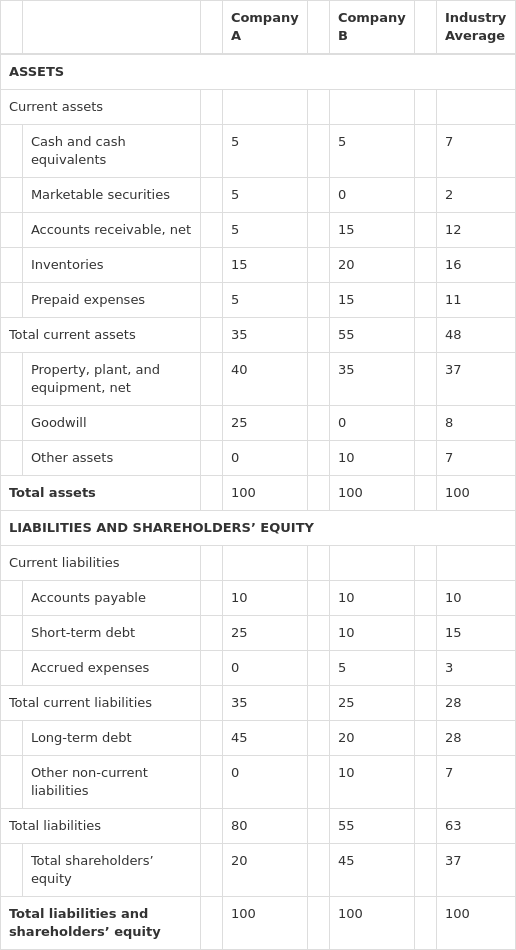
Q. Consider the common-size balance sheets in Exhibit 1 for Company A, Company B, as well as the industry average. Which statement is correct?

Exhibit 1:

Balance Sheet and Industry Average

选项:

A.Company A has below-average liquidity risk.

B.Company B has above-average solvency risk.

C.Company A has made one or more acquisitions.

解释:

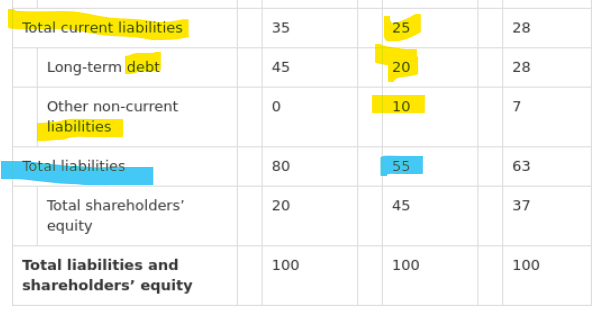
C is correct. The presence of goodwill on Company A’s balance sheet signifies that it has made one or more acquisitions in the past. The current, cash, and quick ratios are lower for Company A than for the sector average. These lower liquidity ratios imply above-average liquidity risk. The total debt, long-term debt-to-equity, debt-to-equity, and financial leverage ratios are lower for Company B than for the sector average. These lower solvency ratios imply below-average solvency risk.

Current ratio is (35 ÷ 35) = 1.00 for Company A, versus (48 ÷ 28) = 1.71 for the sector average.Cash ratio is (5 + 5) ÷35 = 0.29 for Company A, versus (7 + 2) ÷28 = 0.32 for the sector average.Quick ratio is (5 + 5 + 5) ÷35 = 0.43 for Company A, versus (7 + 2 + 12) ÷28 = 0.75 for the sector average.Total debt ratio is (55 ÷ 100) = 0.55 for Company B, versus (63 ÷ 100) = 0.63 for the sector average.Long-term debt-to-equity ratio is (20 ÷ 45) = 0.44 for Company B, versus (28 ÷ 37) = 0.76 for the sector average.Debt-to-equity ratio is (55 ÷ 45) = 1.22 for Company B, versus (63 ÷ 37) = 1.70 for the sector average.Financial leverage ratio is (100 ÷ 45) = 2.22 for Company B, versus (100 ÷ 37) = 2.70 for the sector average.

请问B选项中,55/100这个是啥?total liability/L+E

2 个答案

lynn_品职助教 · 2023年11月09日

嗨,爱思考的PZer你好:


既然不一样,为啥是total debt 是等于题目 里的liability/L+b


是的,这道题没有对debt 和liability进行区分。如下图是把所有黄色的加起来作为total debt ratio=total debt/total assets的分子。


total debt ratio=total debt/total assets

在计算上,如果考试不区分debt和liability,那么debt to capital,debt to assets是一样的。

----------------------------------------------
加油吧,让我们一起遇见更好的自己!

lynn_品职助教 · 2023年11月08日

嗨,努力学习的PZer你好:


公司的capital的来源有两个,分别是发债和发股票融资,total capital就是这两个资金来源的加总。


total asset=Liability+Equity。


题目中的debt不包含不付息的债务(比如Account payable)。


与Total asset相关的Liabilities包含所有债务(付息和不付息的); 与Total Capital相关的Debt只包含付息债务。


正因为liability和debt不一样,导致total asset和total capital不一样。


----------------------------------------------
就算太阳没有迎着我们而来,我们正在朝着它而去,加油!

Helen 🎈 · 2023年11月08日

既然不一样,为啥是total debt 是等于题目 里的liability/L+b

  • 2

    回答
  • 1

    关注
  • 213

    浏览
相关问题

NO.PZ2023081403000042问题如下Q. Consir the common-size balansheets in Exhibit 1 for Company Company well the instry average. Whistatement is correct?Exhibit 1: BalanSheet anInstry AverageA.Company A hbelow-average liquity risk.B.Company B habove-average solvenrisk.C.Company A hma one or more acquisitions.C is correct. The presenof gooill on Company A’s balansheet signifies thit hma one or more acquisitions in the past. The current, cash, anquiratios are lower for Company A thfor the sector average. These lower liquity ratios imply above-average liquity risk. The totbt, long-term bt-to-equity, bt-to-equity, anfinancileverage ratios are lower for Company B thfor the sector average. These lower solvenratios imply below-average solvenrisk.Current ratio is (35 ÷ 35) = 1.00 for Company versus (48 ÷ 28) = 1.71 for the sector average.Cash ratio is (5 + 5) ÷35 = 0.29 for Company versus (7 + 2) ÷28 = 0.32 for the sector average.Quiratio is (5 + 5 + 5) ÷35 = 0.43 for Company versus (7 + 2 + 12) ÷28 = 0.75 for the sector average.Totratio is (55 ÷ 100) = 0.55 for Company versus (63 ÷ 100) = 0.63 for the sector average.Long-term bt-to-equity ratio is (20 ÷ 45) = 0.44 for Company versus (28 ÷ 37) = 0.76 for the sector average.bt-to-equity ratio is (55 ÷ 45) = 1.22 for Company versus (63 ÷ 37) = 1.70 for the sector average.Financileverage ratio is (100 ÷ 45) = 2.22 for Company versus (100 ÷ 37) = 2.70 for the sector average.题目只写到了solvencysolvency有两个公式totbt/totequitytotbt/totbt+totequity我们怎么知道什么时候用什么公式呢?

2024-09-07 18:27 1 · 回答

NO.PZ2023081403000042问题如下Q. Consir the common-size balansheets in Exhibit 1 for Company Company well the instry average. Whistatement is correct?Exhibit 1: BalanSheet anInstry AverageA.Company A hbelow-average liquity risk.B.Company B habove-average solvenrisk.C.Company A hma one or more acquisitions.C is correct. The presenof gooill on Company A’s balansheet signifies thit hma one or more acquisitions in the past. The current, cash, anquiratios are lower for Company A thfor the sector average. These lower liquity ratios imply above-average liquity risk. The totbt, long-term bt-to-equity, bt-to-equity, anfinancileverage ratios are lower for Company B thfor the sector average. These lower solvenratios imply below-average solvenrisk.Current ratio is (35 ÷ 35) = 1.00 for Company versus (48 ÷ 28) = 1.71 for the sector average.Cash ratio is (5 + 5) ÷35 = 0.29 for Company versus (7 + 2) ÷28 = 0.32 for the sector average.Quiratio is (5 + 5 + 5) ÷35 = 0.43 for Company versus (7 + 2 + 12) ÷28 = 0.75 for the sector average.Totratio is (55 ÷ 100) = 0.55 for Company versus (63 ÷ 100) = 0.63 for the sector average.Long-term bt-to-equity ratio is (20 ÷ 45) = 0.44 for Company versus (28 ÷ 37) = 0.76 for the sector average.bt-to-equity ratio is (55 ÷ 45) = 1.22 for Company versus (63 ÷ 37) = 1.70 for the sector average.Financileverage ratio is (100 ÷ 45) = 2.22 for Company versus (100 ÷ 37) = 2.70 for the sector average.quiratio的计算

2024-08-19 18:26 1 · 回答

NO.PZ2023081403000042 问题如下 Q. Consir the common-size balansheets in Exhibit 1 for Company Company well the instry average. Whistatement is correct?Exhibit 1: BalanSheet anInstry Average A.Company A hbelow-average liquity risk. B.Company B habove-average solvenrisk. C.Company A hma one or more acquisitions. C is correct. The presenof gooill on Company A’s balansheet signifies thit hma one or more acquisitions in the past. The current, cash, anquiratios are lower for Company A thfor the sector average. These lower liquity ratios imply above-average liquity risk. The totbt, long-term bt-to-equity, bt-to-equity, anfinancileverage ratios are lower for Company B thfor the sector average. These lower solvenratios imply below-average solvenrisk.Current ratio is (35 ÷ 35) = 1.00 for Company versus (48 ÷ 28) = 1.71 for the sector average.Cash ratio is (5 + 5) ÷35 = 0.29 for Company versus (7 + 2) ÷28 = 0.32 for the sector average.Quiratio is (5 + 5 + 5) ÷35 = 0.43 for Company versus (7 + 2 + 12) ÷28 = 0.75 for the sector average.Totratio is (55 ÷ 100) = 0.55 for Company versus (63 ÷ 100) = 0.63 for the sector average.Long-term bt-to-equity ratio is (20 ÷ 45) = 0.44 for Company versus (28 ÷ 37) = 0.76 for the sector average.bt-to-equity ratio is (55 ÷ 45) = 1.22 for Company versus (63 ÷ 37) = 1.70 for the sector average.Financileverage ratio is (100 ÷ 45) = 2.22 for Company versus (100 ÷ 37) = 2.70 for the sector average. ?

2024-05-22 21:27 1 · 回答

NO.PZ2023081403000042问题如下 Q. Consir the common-size balansheets in Exhibit 1 for Company Company well the instry average. Whistatement is correct?Exhibit 1: BalanSheet anInstry AverageA.Company A hbelow-average liquity risk.B.Company B habove-average solvenrisk.C.Company A hma one or more acquisitions.C is correct. The presenof gooill on Company A’s balansheet signifies thit hma one or more acquisitions in the past. The current, cash, anquiratios are lower for Company A thfor the sector average. These lower liquity ratios imply above-average liquity risk. The totbt, long-term bt-to-equity, bt-to-equity, anfinancileverage ratios are lower for Company B thfor the sector average. These lower solvenratios imply below-average solvenrisk.Current ratio is (35 ÷ 35) = 1.00 for Company versus (48 ÷ 28) = 1.71 for the sector average.Cash ratio is (5 + 5) ÷35 = 0.29 for Company versus (7 + 2) ÷28 = 0.32 for the sector average.Quiratio is (5 + 5 + 5) ÷35 = 0.43 for Company versus (7 + 2 + 12) ÷28 = 0.75 for the sector average.Totratio is (55 ÷ 100) = 0.55 for Company versus (63 ÷ 100) = 0.63 for the sector average.Long-term bt-to-equity ratio is (20 ÷ 45) = 0.44 for Company versus (28 ÷ 37) = 0.76 for the sector average.bt-to-equity ratio is (55 ÷ 45) = 1.22 for Company versus (63 ÷ 37) = 1.70 for the sector average.Financileverage ratio is (100 ÷ 45) = 2.22 for Company versus (100 ÷ 37) = 2.70 for the sector average.算下来A公司的流动性风险不是都低于平均水平吗

2024-03-24 15:31 1 · 回答

NO.PZ2023081403000042问题如下Q. Consir the common-size balansheets in Exhibit 1 for Company Company well the instry average. Whistatement is correct?Exhibit 1: BalanSheet anInstry AverageA.Company A hbelow-average liquity risk.B.Company B habove-average solvenrisk.C.Company A hma one or more acquisitions.C is correct. The presenof gooill on Company A’s balansheet signifies thit hma one or more acquisitions in the past. The current, cash, anquiratios are lower for Company A thfor the sector average. These lower liquity ratios imply above-average liquity risk. The totbt, long-term bt-to-equity, bt-to-equity, anfinancileverage ratios are lower for Company B thfor the sector average. These lower solvenratios imply below-average solvenrisk.Current ratio is (35 ÷ 35) = 1.00 for Company versus (48 ÷ 28) = 1.71 for the sector average.Cash ratio is (5 + 5) ÷35 = 0.29 for Company versus (7 + 2) ÷28 = 0.32 for the sector average.Quiratio is (5 + 5 + 5) ÷35 = 0.43 for Company versus (7 + 2 + 12) ÷28 = 0.75 for the sector average.Totratio is (55 ÷ 100) = 0.55 for Company versus (63 ÷ 100) = 0.63 for the sector average.Long-term bt-to-equity ratio is (20 ÷ 45) = 0.44 for Company versus (28 ÷ 37) = 0.76 for the sector average.bt-to-equity ratio is (55 ÷ 45) = 1.22 for Company versus (63 ÷ 37) = 1.70 for the sector average.Financileverage ratio is (100 ÷ 45) = 2.22 for Company versus (100 ÷ 37) = 2.70 for the sector average.这道题明确将Short term bt与Long term bt区分开来写了,为什么答案里面用了TL算leverage,我应该用ST➕LT不是更好

2023-12-25 23:57 1 · 回答