NO.PZ202208300200000304
问题如下:
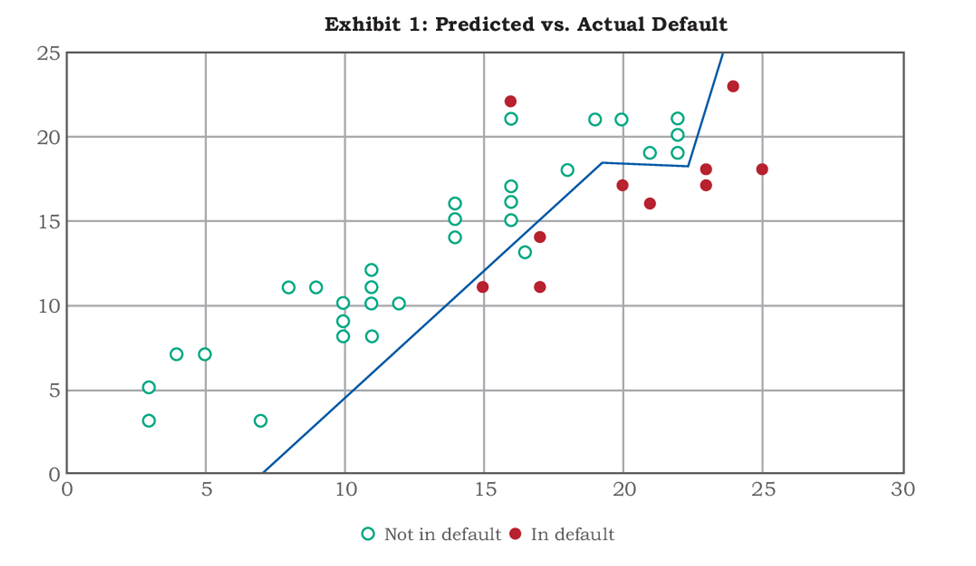
Based on Exhibit 1, the initial results can be best described as being:
选项:
A.overfitted.
B.underfitted.
C.a good fit.
解释:
SolutionA is correct. The model predictive output, which is shown to be very non-linear, fits the training set too well and will not likely generalize well to new data, which is known as overfitting.
B is incorrect. An underfitted model would show a more linear output with multiple misclassifications between expected and actual results.
C is incorrect. A model with “good fit” would show a more linear output with some misclassifications between expected and actual results that have no defined pattern.
从哪里可以看出预测不准?另外这个图横纵坐标代表什么?